Measuring first normal stress difference at high shear rates via capillary rheometer
The Add-on "Normal Stress Die" which was developed in cooperation with the "Institute for Technical and Polymer Chemistry" (Working Group of Prof. Wilhelm) of the KIT in Karlsruhe, serves as an Add-on for polymer differentiation for the updated series of Capillary Rheometers and as a modular retrofit for existing instruments.
First normal stress difference in shear flow is believed to be responsible for some material properties such as die swell and flow instabilities. First normal stress difference is commonly measured in cone-plate geometries up to the shear rates of around 10 s-1 by using a rotational rheometer. At higher shear rates the measurement is limited either by the torque or normal force threshold of the instrument or by some material related limitations e.g., edge fracture. The new Add-on “Normal Stress Die” for Capillary Rheometer is designed to simultaneously measure steady-state shear viscosity, elongation viscosity and first normal stress difference at higher shear rates (>10 s-1) by using a capillary rheometer.
The Addon “Normal Stress Die” is composed of two parts, slit part and radial part. Steady-state shear viscosity is measured in the slit part and first normal stress difference is measured in the radial part and elongation viscosity by the entrance pressure loss.
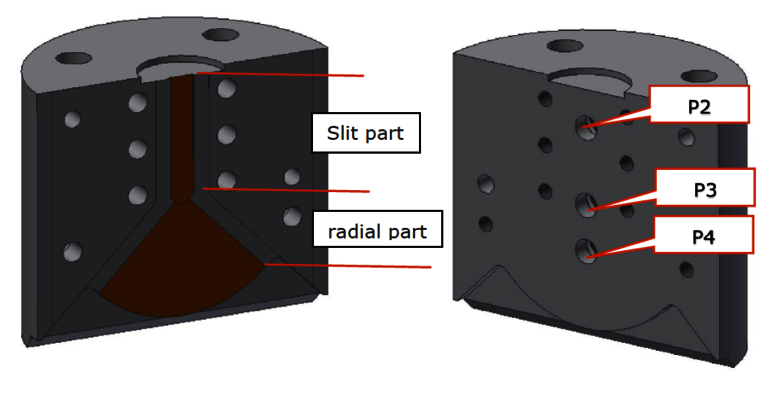 Figure 1: Open parts of the slit-radial die. (a) Channel half and (b) Sensor half
Steady-state viscosity is calculated by the pressure loss of P2-P3. Bagley correction is not necessary since the pressure is measured with the pressure difference of the pressure transducers inside the die (P3-P2). The steady-state viscosity is obtained after Weissenberg-Rabinowitsch correction.
Elongation viscosity is calculated using the Cogswell model from the entrance pressure loss measured between P1 in the barrel and the extrapolated pressure at the entry of the capillary extrapolated from pressure P2 and P3.
First normal stress difference is calculated in the radial part of the Normal Stress die.
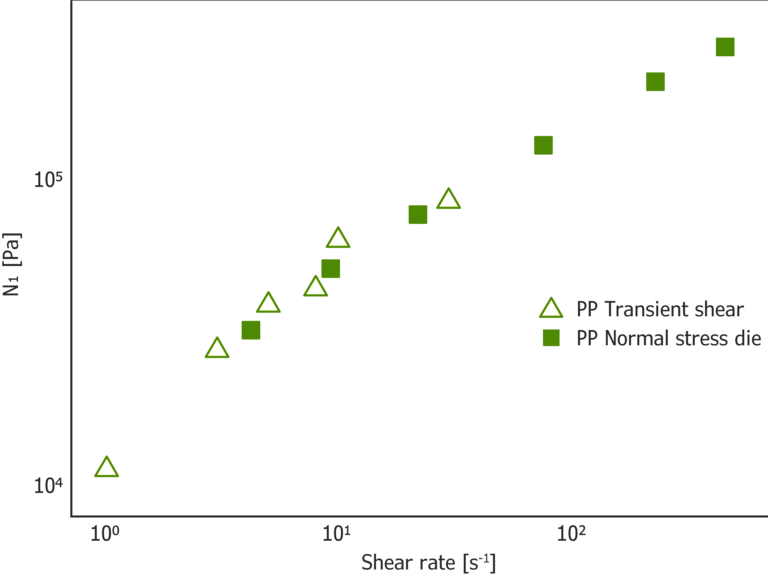 Figure 2: First normal stress difference vs shear rate for PP at 230 °C. The open symbols are transient shear data by 13 mm cone-plate geometry. The filled symbols are data from Normal Stress die
Figure 2 shows a good agreement between the steady-state first normal stress difference as a function of shear rate obtained from transient shear experiment with 13 mm cone-plate geometry and Normal Stress die at 230 °C for polypropylene.
Flow Instabilities and first normal stress difference
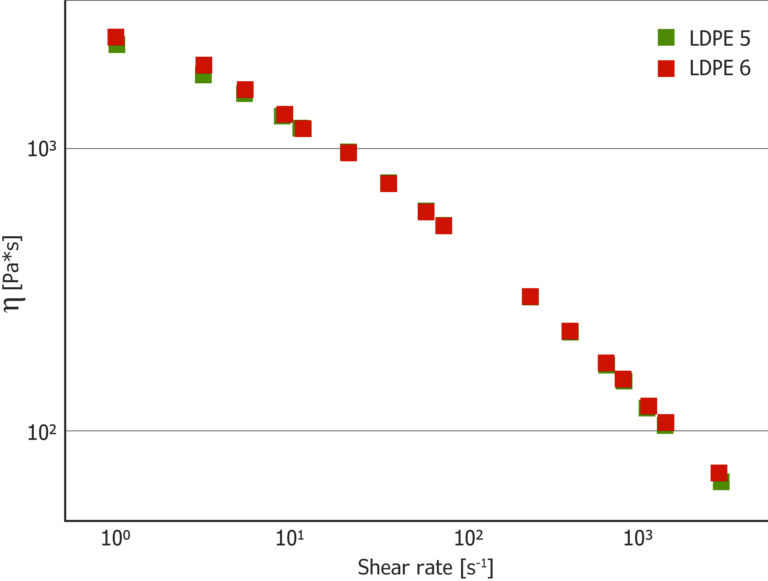 Figure 3: Bagley and Weissenberg-Rabinowitsch corrected steady-state shear viscosity measured by capillary dies at 180 °C for two LDPEs
Figure 3 shows steady-state viscosity of two LDPE samples. Despite having the same viscosity over a broad range of shear rate, they show very different processing behavior. In a capillary rheometer with a 3/0.3/30 mm/mm/mm W/T/L slit die at 180 °C, LDPE 6 shows instabilities at shear rate of 500 s-1 whereas LDPE 5 does not show instabilities up to the examined shear rate of 800 s-1.
As both first normal stress difference and the entrance pressure loss (dPe) are the determining factor for the onset of instabilities, Figure 4 draw the ratio of first normal stress difference over entrance pressure loss (dPe) against shear rate. In this graph and contrary to the viscosity graph the trend of the two samples is different.
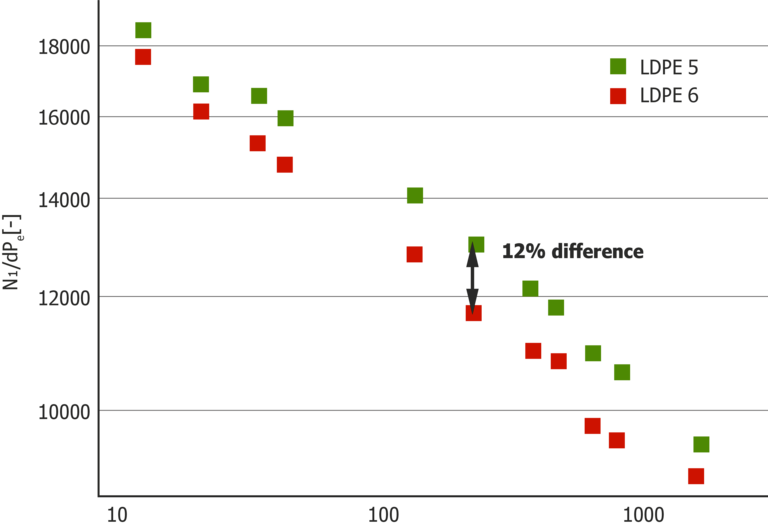 Figure 4: First normal stress difference divided by entrance pressure loss (dPe) plotted as a function of shear rare at
180 °C for LDPE 5 and LDPE 6
Figure 4: First normal stress difference divided by entrance pressure loss (dPe) plotted as a function of shear rare at
180 °C for LDPE 5 and LDPE 6
To show the correlation between the plot of N1/dPe vs shear rate and the onset of instabilities, 6 LDPEs are studied. Figure 5 shows Bagley and Weissenberg-Rabinowitsch corrected steady-state shear viscosity of the samples at 180 °C. The onset of instabilities in a 3/0.3/30 mm/mm/mm W/T/L slit die at 180 °C is reported in Table 1.
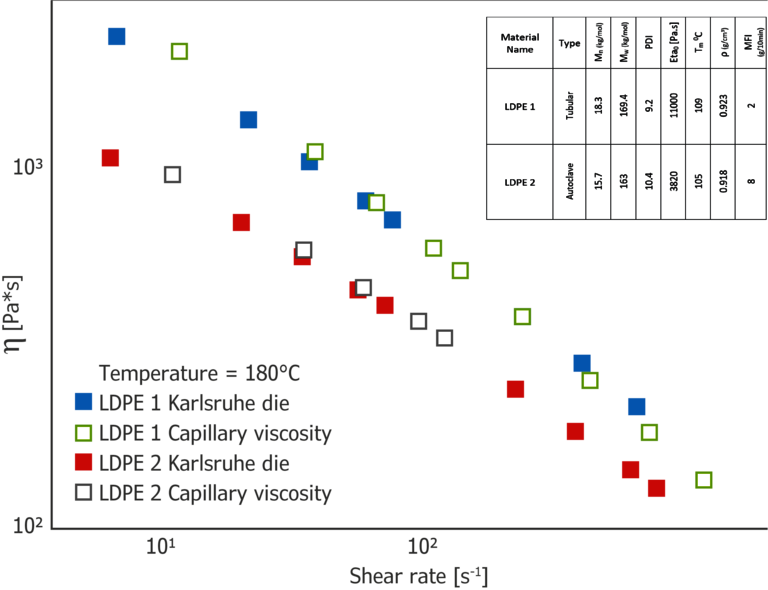 Figure 5: Steady-state shear viscosity vs shear rate of LDPEs obtained from slit part of the Normal Stress die at 180 °C
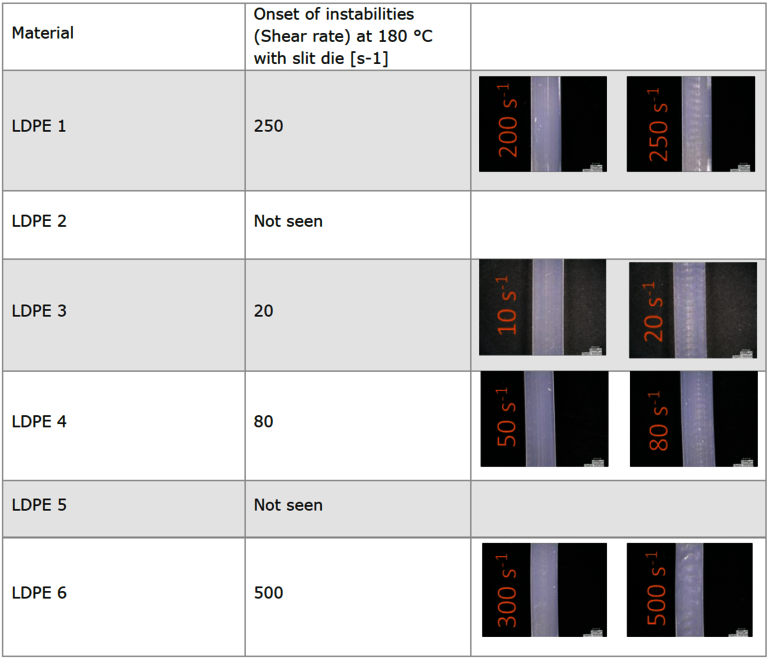 Table 1: The onset of instabilities for different LDPEs at 180 °C
Figure 6 depicts the graph of N1/dPe vs shear rate for the 6 LDPEs. Compared to the shear rate at which the instabilities start (Table 1), the samples located at the upper-right side of the graph, manifest instabilities at higher shear rates.
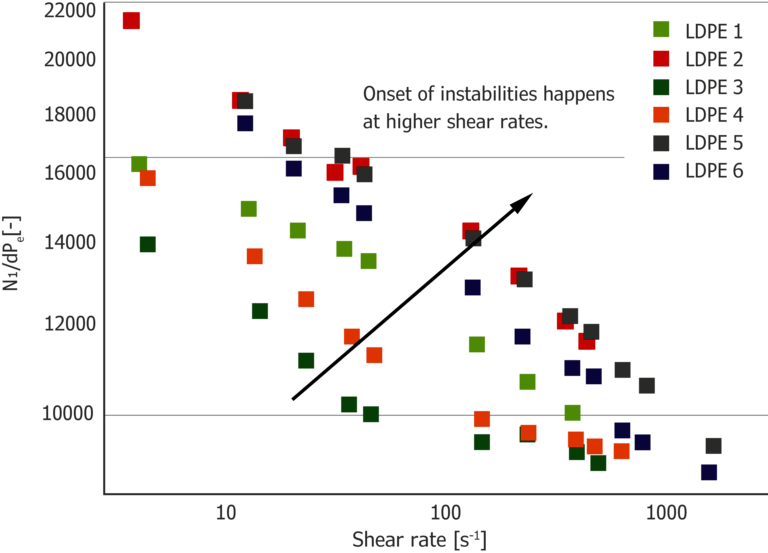 Figure 6: First normal stress difference divided by entrance pressure loss (dPe) plotted as a function of shear rate at 180°C for different LDPEs
The RG Addon “Normal Stress Die” can simultaneously measure steady-state shear viscosity, elongation viscosity and first normal stress difference. The viscosity obtained from the slit part of Normal Stress die after Weissenberg-Rabinowitsch correction matches the viscosity measured with capillary dies after Bagley and Weissenberg-Rabinowitsch corrections. Elongation viscosity is derived from the entrance pressure into the die. First normal stress difference obtained from Normal Stress die at high shear rates follows the same trend as transient shear data at low shear rates. Thus, a good accordance between the data of normal stress die and transient shear data is visible. Normal stress die allows an effective determination of normal stress at high shear rates and closer to the processing shear rates which was not possible with conventional technique. For the two LDPEs with the same steady-state shear viscosity in a broad range of shear rate yet different processing behavior, the graph of N1/dPe vs shear rate show 12% difference between the two LDPEs.
Further the onset of flow instabilities is correlated to first normal stress difference and entrance pressure drop (graph of N1/dPe vs shear rate). The materials with lower N1/dPe for the same shear rate, show onset of instabilities at lower shear rates.
A use of the data for process simulation of converging areas (geometrically similar the radial part of the die) also seems to be possible. This simulation should give a better description of the real process because of a higher similarity of the flow. Normal stress die expands the horizon to measure the data at shear rates matching the shear rates of processing operations. Flow simulation utilizes the data to accurately predict the flow behavior inside the injection molding dies and outside of the extrusion dies.
Commonly the first normal stress data is measured by rotational rheometers in a cone-plate geometry. Table below lists some comparison between cone-plate geometry, adaptable to rotational rheometers and normal stress die.
| Cone-plate geometry | Normal Stress Die |
| Works up to 10 s-1 | Works up to 1000 s-1 and more |
| It takes at least half a day to get the data for 5 shear rates. | Less than half an hour one can get data for 5 shear rates. |
| Sample preparation is needed | Sample preparation is not needed |
| Expensive rotational rheometer is needed | Optional add-on to capillary rheometer |
| Data are not applicable for process simulations | Data can be used for process simulations since the measured shear rates match the processing shear rates The flow in normal stress die is like the flow in molds and transfer channels. |