Comparison between different viscosity models
Viscosity measurements are performed with a high pressure capillary rheometer at discrete shear rates. In transition zones of the real process, or especially in flow simulation, a mathematical function of the slope of viscosity, as a function of shear rate, is necessary to calculate points in-between the measured data. Therefore, models have be developed to describe the mathematical connection of the measured viscosity data, as a function of shear rate. The models have different strengths and weaknesses and most are only suited for specific materials. The following list of models is restricted to those that are integrated in our standard Capillary Rheometer Software.
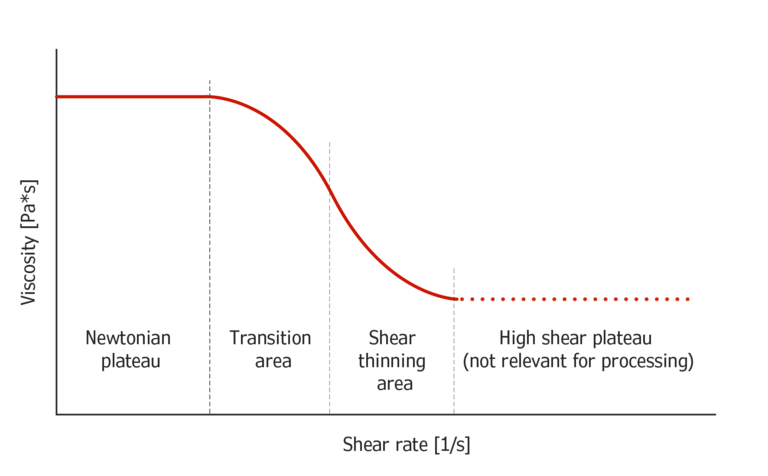 Figure 1: principle slope of viscosity
Viscosity starts from a level of constant viscosity, the so called Newtonian plateau, then turns to a transition area with changing slope, followed by a shear thinning area. At very high shear rates either melt fracture occurs, or a plateau is reached again, but this area is not relevant for processing and not described in common flow models.
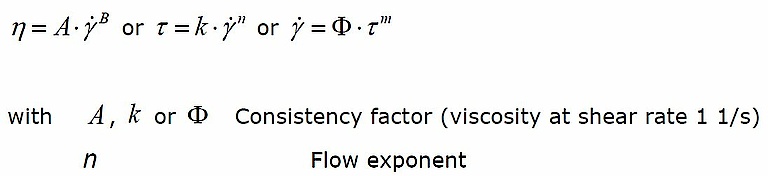
Ostwald – de Waele (power law)
Especially elastomers can be described quite well by this simple model, which describes the slope of the shear thinning area. For thermoplastic materials it is less suitable, because of the Newtonian plateau and transition zone. It must only be applied in the pseudo plastic (shear thinning) range, because the curvature of the viscosity in the transient area is not described. If drawn with double logarithmic axis, the model is a straight line.
Carreau – Winter
The 3–Parameter expression also covers the so-called Newtonian Plateau, transition and shear thinning area. The viscose flow behavior is described in a physically meaningful way over a wide shear rate region, especially in the region of larger shear rates.
The zero-shear viscosity (Newtonian plateau) is proportional to the average molar mass. The molecular weight distribution range has influence on the transition time, as well as on the viscosity exponent (shear thinning area).
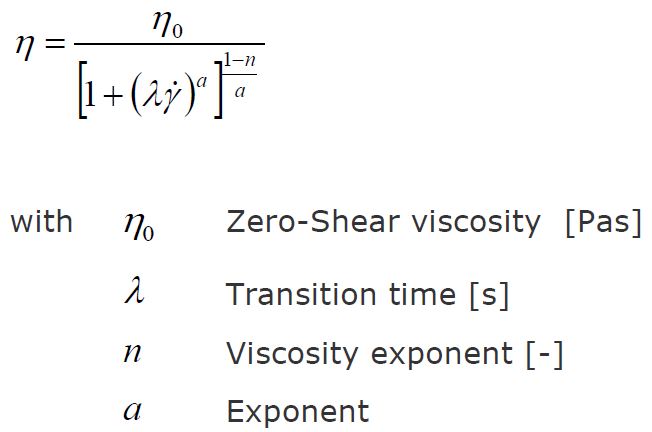
Yasuda (modified Carreau – Model)
Yasuda is an extended Carreau model, which describes the viscosity of branched thermoplastic materials. These kinds of materials show a typical curvature of the viscosity in the transient area between zero-shear viscosity and pseudo plastic (shear thinning) area, which can be described with the additional exponent. Typically, this model also fits quite well at low and high shear rates. As the model fits well over the whole measured shear rate, extrapolation is also possible with a high level of confidence.
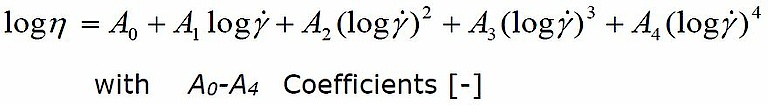
Muenstedt
This 4-Degree polynomial expression is a mathematic approximation of the viscosity function. The function typically matches the experimental data very well, but because of its purely mathematic nature, data extrapolation is not advised.
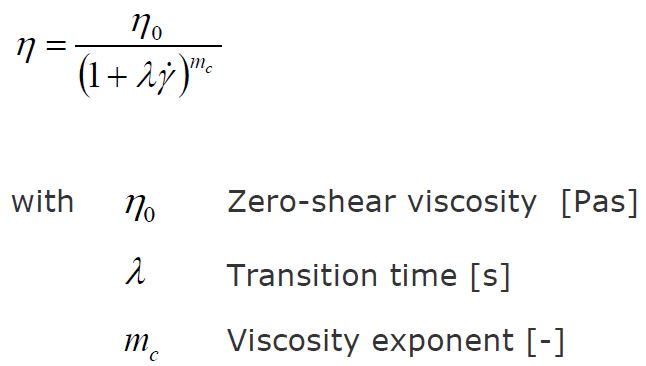
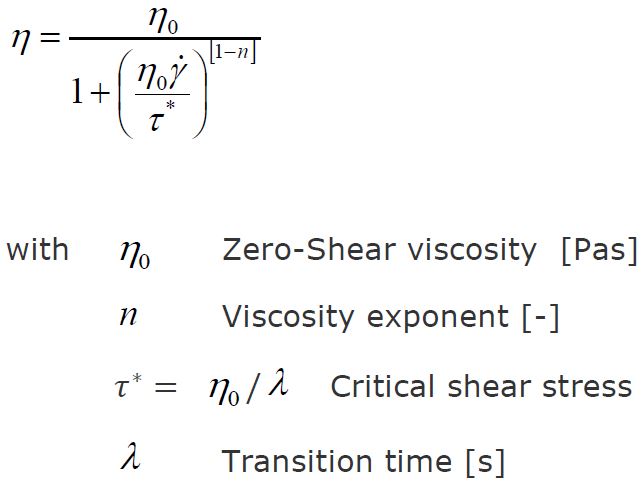
Cross
The cross model is similar to the Carreau-Winter Model. The exponent is applied differently, which leads to a slightly different form of the curve.
Comparison of models with HDPE
Figure shows the Ostwald model calculated from measurement data with HDPE, drawn with log-log scaling. The graph shows, why it makes little sense to use the Ostwald model over the whole shear rate range of this thermoplastic HDPE test. The typical curvature at the onset of the shear-thinning region cannot be modelled accurately.
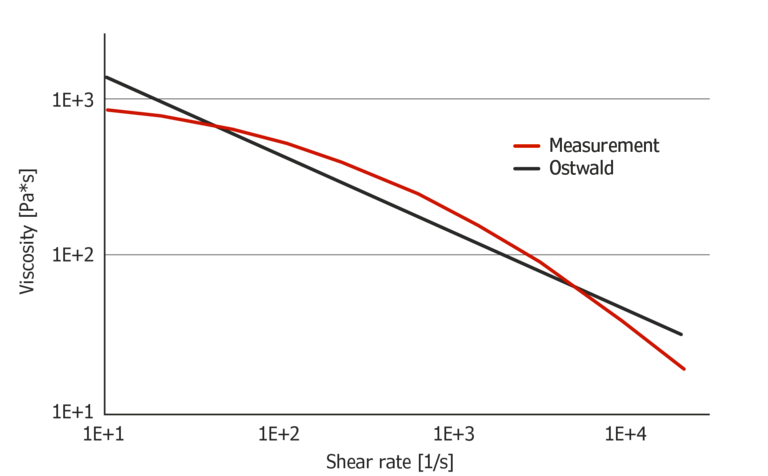 Figure 2: Ostwald model calculated from measurement data of HDPE
The Carreau model shown in Figure 3 fits the data more closely and resembles the curve quite well. Still, there are some smaller discrepancies between the measured data and the model. The Cross model also fits the measured data quite well, with smaller discrepancies especially at higher shear rates.
In a direct comparison the Cross model is more accurate at low shear rates, while the Carreau model is more accurate for high shear rates. The curvature of the models are slightly different, because of the different position of the exponent in the denominator of the equations.
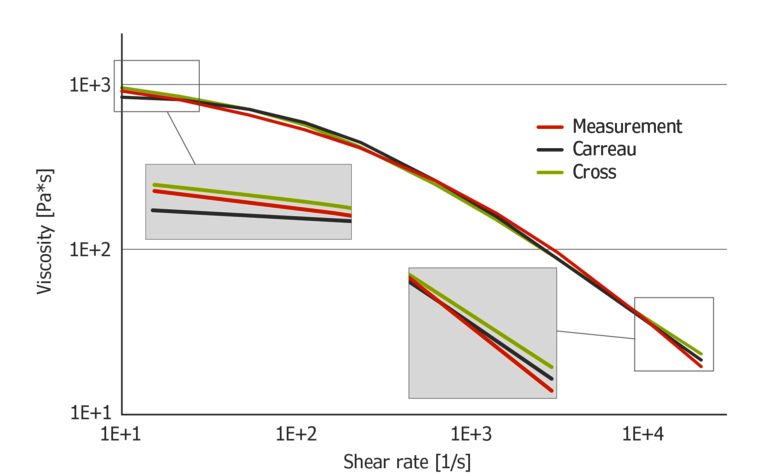 Figure 3: Carreau and Cross model calculated from measurement data of HDPE
Figure 4 shows the Muenstedt and Yasuda model, calculated from measurement data with HDPE. Both models perfectly fit the data. While Muenstedt is a purely mathematical approximation of the data, Yasuda’s equation is physically plausible.
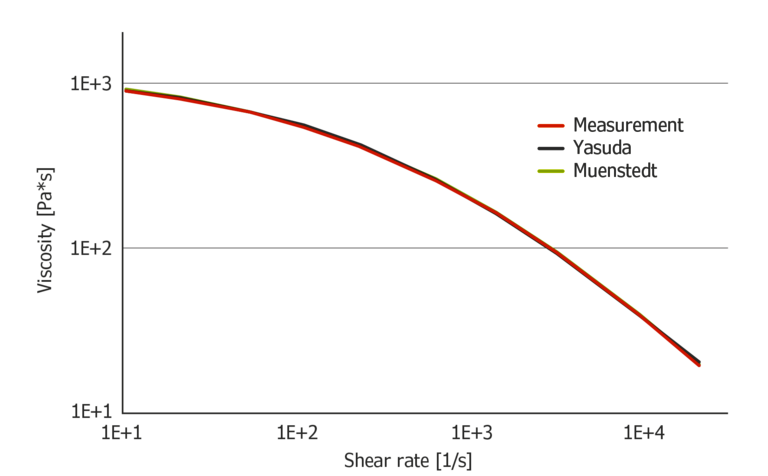 Figure 4: Muenstedt and Yasuda model calculated from measurement data of HDPE
Extrapolation of data
Figure shows the extrapolation of data using the Carreau and Cross models. The results with Carreau seem to be a bit more plausible at high shear rates. At low shear rates, the Cross model results seem to be more accurate.
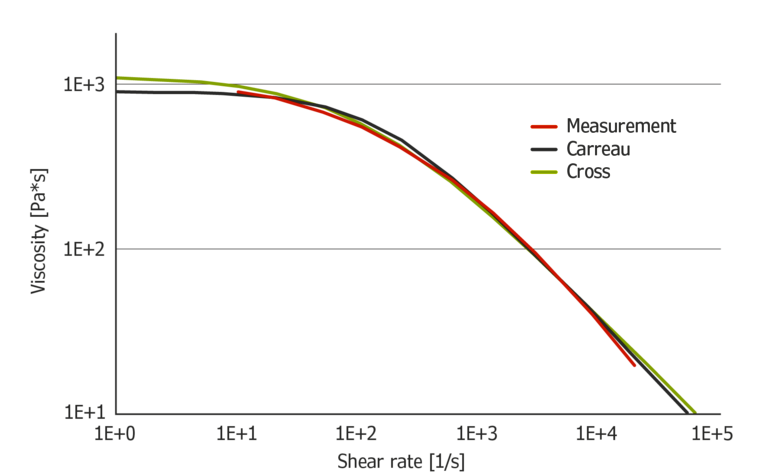 Figure 5: Extrapolation of HDPE measurement data using Carreau and Cross
Compared to Cross and Carreau, Muenstedt and Yasuda fit the data more closely and are therefore better suited for data extrapolation, at least with this material. Compared to Muenstedt, Yasuda calculates slightly lower viscosities at low shear rates, and slightly higher ones, at high shear rates. For extrapolation Yasuda seems to be the most suited model because of its accurate data replication and physically plausible equation.
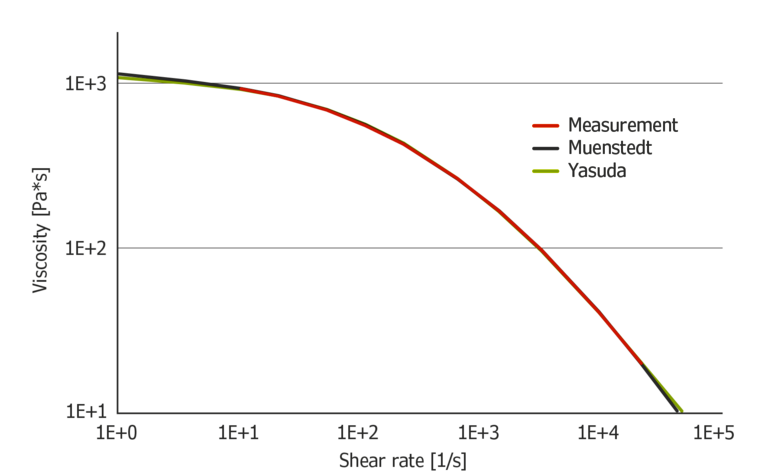 Figure 6: Extrapolation of HDPE measurement data using Muenstedt and Yasuda
Overall the best model to use is always dependent on the material. The results of different models should be compared and the best suited model must be chosen for any given application.
The easiest way to select the best model is to compare the correlation coefficient, also given with the model coefficients. The ideal fit is given by a correlation coefficient of 1.