Due to the high material and compound prices, plastic and elastomer components are often
produced using injection molding processes. Thermoplastics and elastomers are processed in hot
runner technology and in cold runner technology respectively in order to save material and thus
resources. The runner and the inclusion of valve gate systems in conjunction with high injection
speeds lead to high pressure build-up during the injection phase. To minimize shrinkage and
warpage, the pressure in the holding pressure phase is kept constant, with the material moving
only very slowly. The flow behavior of thermoplastic and elastomer melts shows a high-pressure
dependence in addition to temperature.
Status of current simulation programs
Today’s simulation programs allow three-dimensional flow simulations, wherein partially viscoelastic
model approaches are also used. The compressibility of polymer melts is considered in the
flow simulation by a simple extension of the incompressible calculation approaches (Navier-Stokes
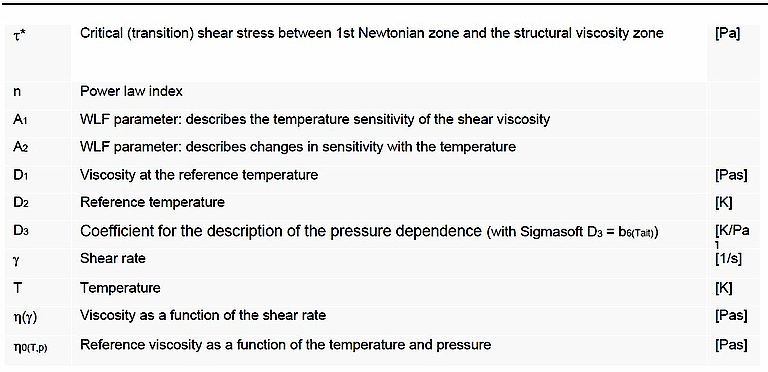
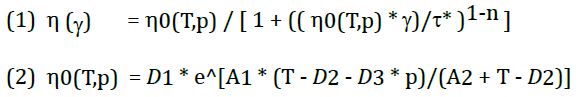
equation of motion). This is done, for example, using the Cross-WLF viscosity model (equations 1
and 2). The relevant coefficient D3 in the system of equations shall take into account the
dependence of the shear viscosity curve on the level of the absolute pressure in the pipe flow.
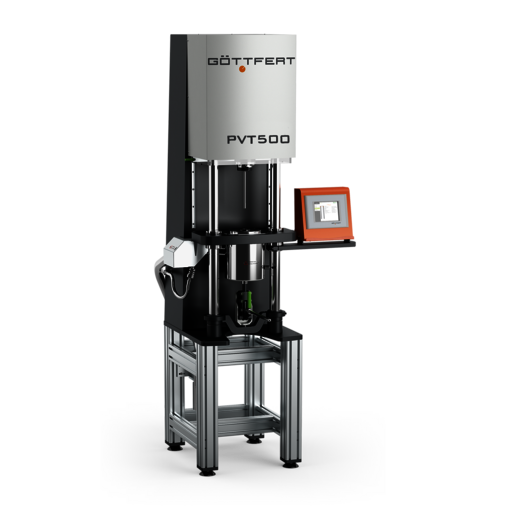
PVT measurements are the simplest solution for determining the pressure dependence of
polymers. GÖTTFERT offers the possibility to carry out a PVT measurement with an independent
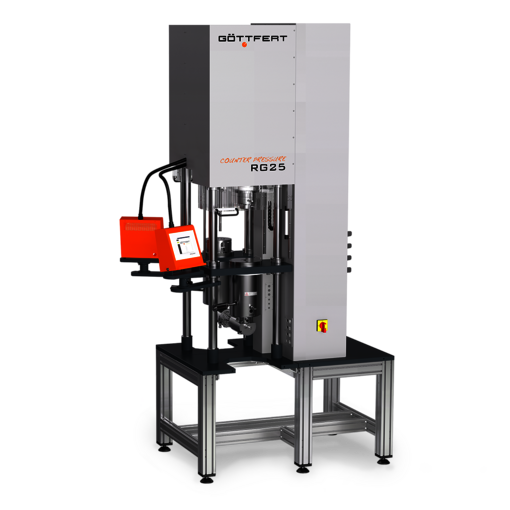
PVT device (dilatometer), the PVT500. Another possibility is offered by the add-on range of the
series of high-pressure capillary rheometers (HCR). Both the PVT device and the capillary
rheometer (PVT add-on) always determine the p-v-t behavior of a polymer melt at rest. In the
injection molding process, however, these are dynamic processes, meaning that the material
properties change.
Devices for determining the pressure dependence of the viscosity
The pressure dependence of the viscosity can be determined directly during rheological measurements with the aid of an optionally available counter pressure chamber or with the GDV75 counter pressure viscosimeter.
The counter pressure chamber is a throttle chamber and described in Figure 1. The gap between the truncated cone and the mating surface is continuously closed by a circular angle of 360° (e.g. 270°, 180° and 90°), thus increasing the flow resistance and the absolute pressure. Additional reference measurements without a counter pressure chamber provide additional viscosity curves under normal measuring conditions.
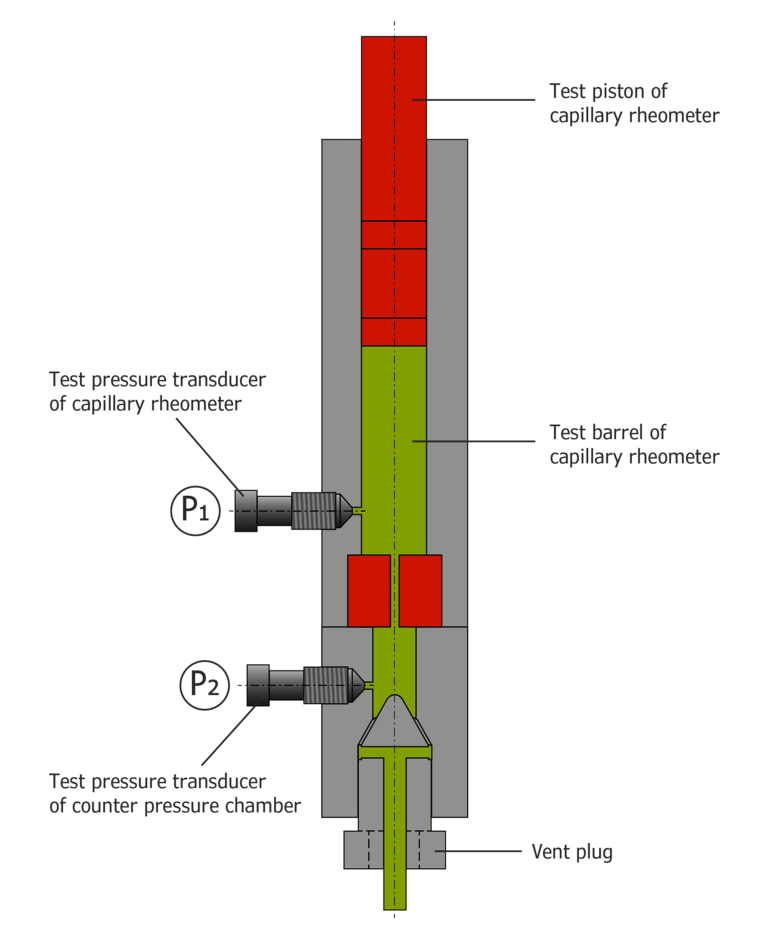 Figure 1: Counter pressure chamber
The counter pressure viscosimeter essentially consists of two capillary rheometers. This allows the pressure at the capillary outlet to be regulated (Figure 2).
For this purpose, one capillary rheometer (device 1) is equipped with a measuring capillary at the outlet, while the other capillary rheometer operates without capillaries. The test barrels are connected at the outlet via a connecting barrel so that extrusion from one device to another is possible. Pressure transducers in front of and behind the capillary measure the pressure. Like a conventional capillary rheometer, device 1, which is equipped with a capillary, works either in a speed-controlled or a pressure-controlled manner in the direction of the arrow. After flowing through the capillary of the counter pressure viscosimeter, device 2 picks up the melt via the connecting barrel and operates at a previously set pressure level. Measurement under constant counter pressure is, therefore, also possible at low shear rates.
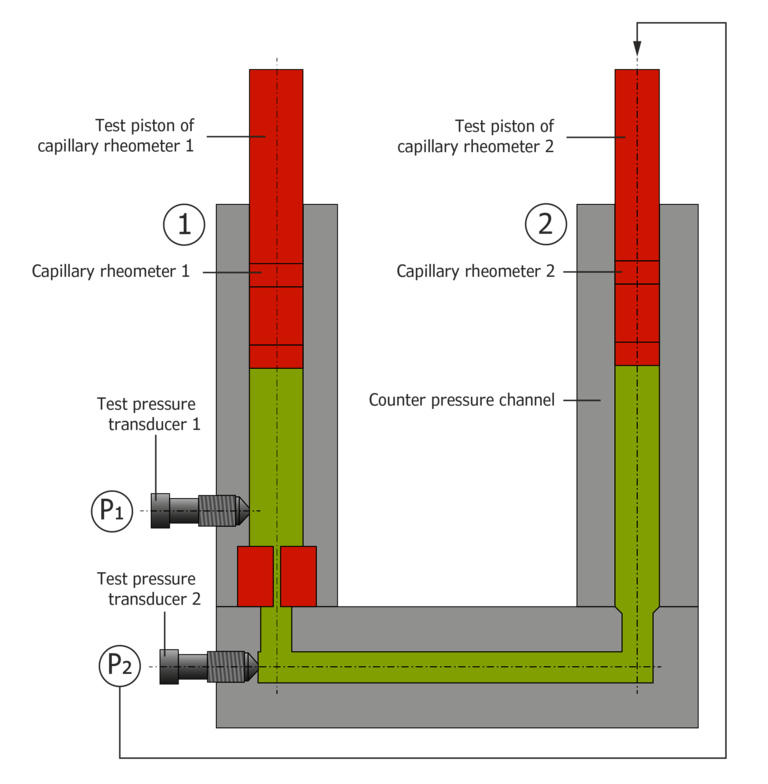 Figure 2: counter pressure viscosimeter
The following pressure dependence measurements of the viscosity were carried out with the counter pressure viscosimeter on polycarbonate and a fluor rubber compound.
Figure 3 shows the curves of the apparent shear viscosity at counter pressures of 50, 200, 400, 600, 1000 and 1200 bar. The curves show a pronounced plateau of zero viscosity that is typical for PC. This shifts to smaller shear rates with increasing pressure. The pressure dependence decreases with an increasing shear rate. These effects can likewise be observed with a decreasing temperature. In other words, pressure dependence behaves in a completely different manner to temperature dependence.
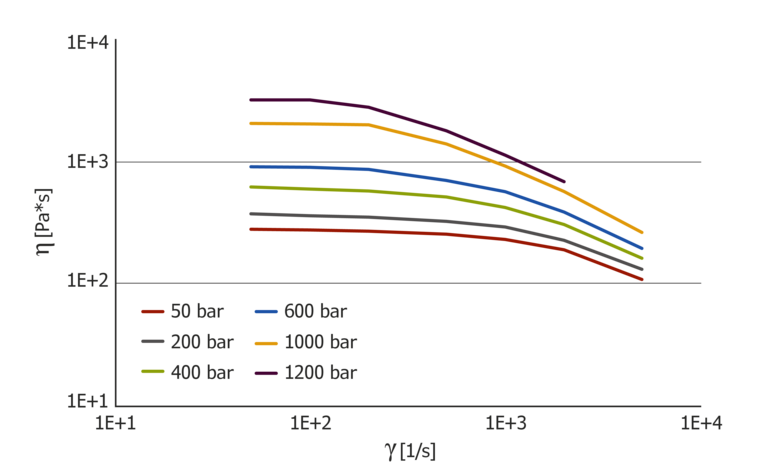 Figure 3: pressure-dependent viscosity curves for PC
It is possible to shift the individual pressure curves to a master curve from which the pressure coefficient can then be determined (Figure 4). The pressure coefficient depends on the shear rate and changes for this material by a factor of 10 from high to low shear rates. This means: Compressibility during the injection phase at high shear rates is fundamentally different from compressibility during the holding pressure phase at low shear rates. Due to the high-pressure dependence, the holding pressure may not be effective with long flow paths if this compressibility is not taken into account.
If the pressure coefficient is determined from the PVT diagram, the result is a value of 39.1*10-8K/Pa.
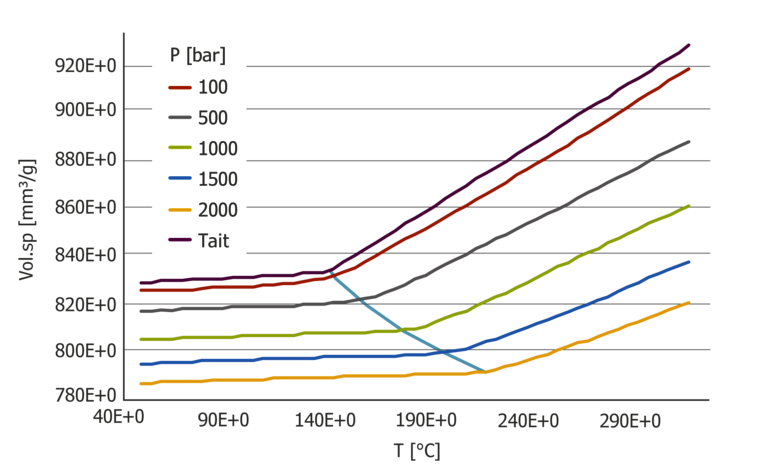 Figure 5: PVT diagram with Tait evaluation for PC – standard determination of the D3 coefficient
At high shear rates, this value deviates by a factor of 30 from the value determined using the pressure-dependent viscosity measurement. Close to 10 with small shear rates.
Pressure dependence of the viscosity with an FKM elastomer compound
In the following, the influence of the pressure dependence for a carbon black filled FKM compound at 100 °C and 150 °C is shown. The test was performed with two capillary lengths of 20/1 mm and 0/1 mm (length/diameter) on the GDV75. Each flow curve was calculated using the Bagley and Rabinowitsch-Weissenberg correction, meaning both the viscosity function and the extensional viscosity function can be applied as a function of pressure.
In addition, the carbon black filled elastomer compound shows a clear pressure dependence of the viscosity and the extensional viscosity.
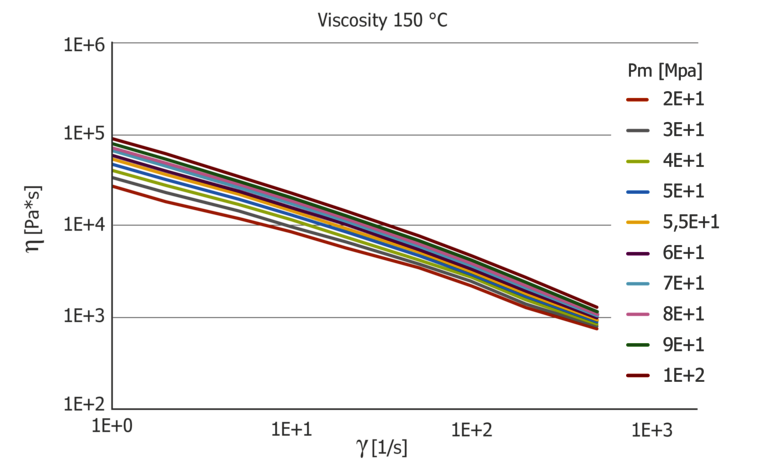
The pressure dependence of the viscosity is shown in Figure 6. In contrast to polycarbonate, the viscosity curves at 100 °C show a pronounced “power-law” fluid which, however, at 150 °C already shows a transition range with simultaneously higher-pressure dependence. Lowering the temperature by 50 °C causes the pressure to increase by about 1000 bar.
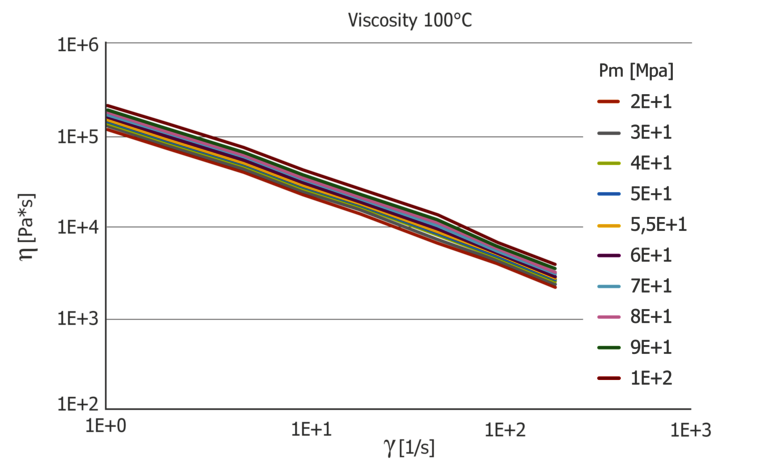 Figure 6: Pressure-dependent viscosity function at 100 °C and 150 °C
The pressure coefficient at 100 °C shows a low shear rate dependence, while the pressure coefficient is very pronounced at 150 °C with a factor of 3 between the lowest value at high shear rates and the highest value at low shear rates. The pressure coefficient also depends greatly on the temperature and it is easy to see that a constant coefficient for the pressure dependence, determined with the PVT diagram via the B6 coefficient, does not describe this. The B6 coefficient from the Tait model results in 1.11*10-7 K/Pa and is clearly different from the pressure coefficients determined.
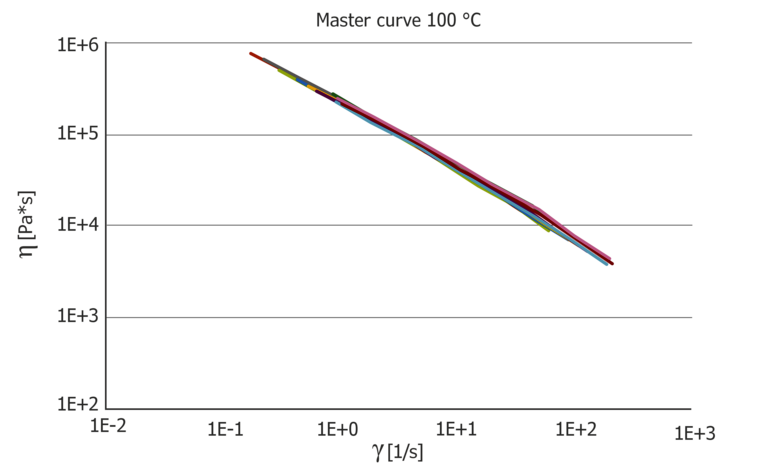
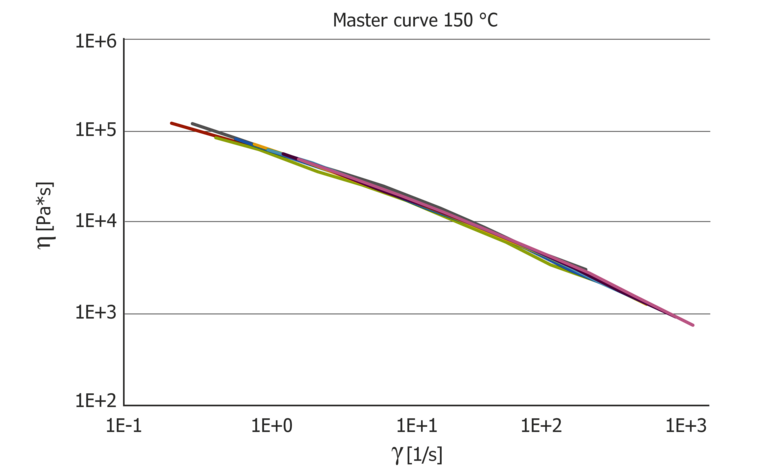 Figure 7: Resulting pressure master curves at 100 °C and 150 °C, which then show the pure temperature influence and the pressure coefficient in comparison.
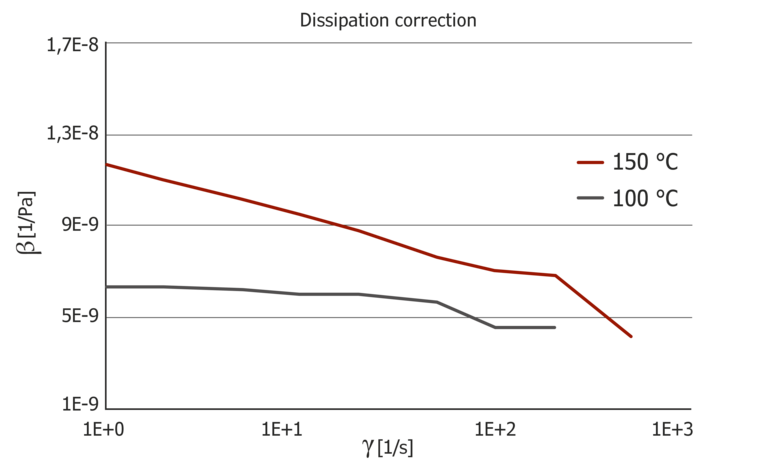 Figure 8: Pressure master curves and pressure coefficient at 100 °C and 150 °C
In addition to the shear viscosity, the extensional viscosity calculated from the inlet flow is also pressure dependent. Figure 8 shows the pressure dependence of the extensional viscosity μ for 100 °C and 150 °C applied via the extensional velocity ε. Similar to the viscosity, the extensional viscosity shows strong temperature dependence, which is more pronounced than the pressure dependence. The extensional viscosity was calculated using the Cogswell model.
The pressure dependence of the extensional viscosity is greater than the pressure dependence of the shear viscosity.
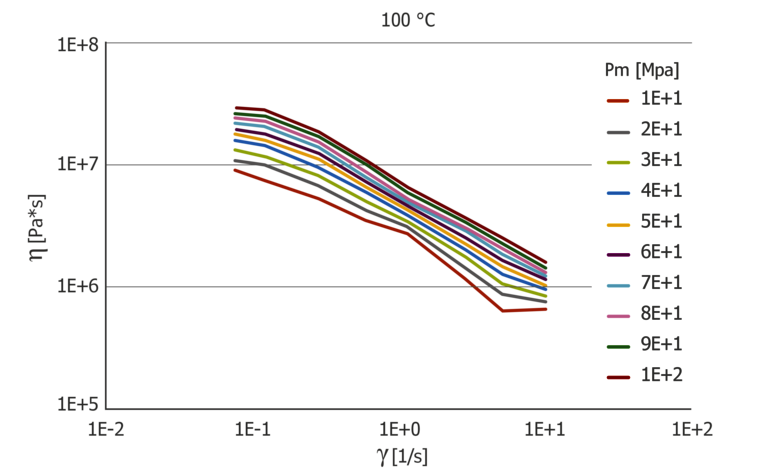
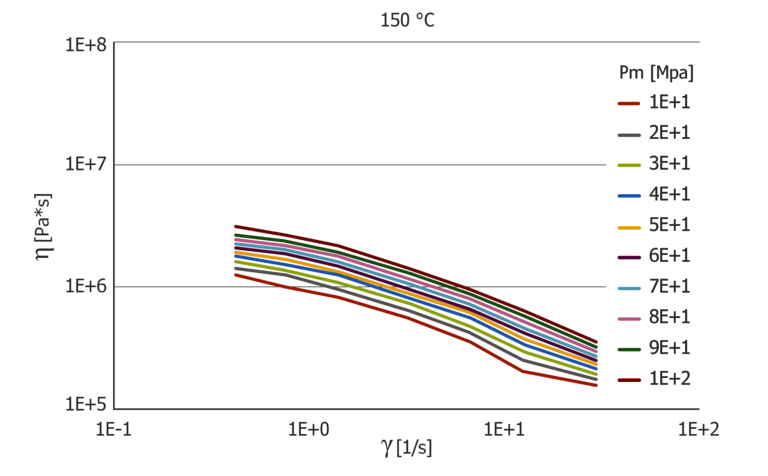 Figure 9: Pressure-dependent extensional viscosity function at 100 and 150 °C
The data can also be shifted to master curves and the pressure coefficient can be calculated from this.
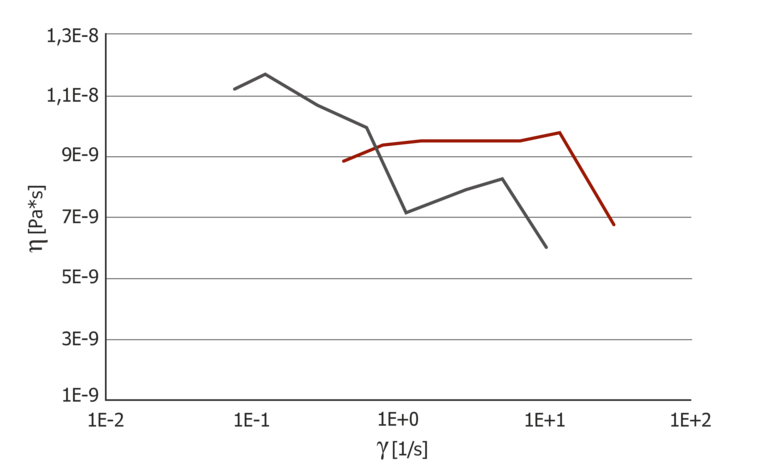 Figure 10: Pressure coefficient for extensional viscosity at 100 °C and 150 °C
The pressure coefficient of the extensional viscosity behaves conversely to that of the shear viscosity. At 100 °C, there is a strain rate dependence that is also higher than the shear rate dependence. At 150 °C, the trend of the pressure coefficient is almost constant. Direct measurement of the pressure dependence of the extensional viscosity via a counter pressure chamber or a counter pressure viscosimeter is the only way to determine the pressure dependence of the extensional viscosity; there are no alternative methods.
Conclusion
The results show that the method used so far to determine the pressure dependence of the viscosity via the PVT diagram is unsuitable. The values determined with a static load via a PVT measurement provide varying values than with a dynamic load under shear stress. The method is also very well suited when it comes to determining not only the pressure dependence of the viscosity under shear stress but also the pressure dependence of the viscosity under elongation stress. In particular, pressure dependence of the extensional viscosity in the extensional flow can only be determined using the counter pressure chamber or the counter pressure viscosimeter.
Alternatively, the pressure superimposed shear test is also suitable for testing foams and shear-induced crystallization.