pvT-measurements are used to determine the thermodynamic behaviour of plastics, elastomers, thermosets and liquids. Here, the specific volume is determined as a function of the variables of pressure and temperature. pvT-measurements are essential for the following applications:
PVT500 operates according to ISO 17744, which distinguishes between isothermal and isobaric measuring method. During isothermal measuring, the sample is exposed to different pressures at a constant temperature. The isobaric measurement method is carried out at constant pressure, wherein the sample is cooled at a defined cooling rate.
The isothermal measuring method is still one of the most common applications, however the isobaric measuring method describes the process significantly better. This is especially the case in injection molding because the molding cools down at constant pressures (upto sealing- or freezing point of the sprue system). Such a handling process is usually used at current tool designs.
The new PVT500 offers several advantages in comparison to the optional available Add-on for Capillary Rheometer:
Test: Isobaric – cooling rate 2,5K/min
Test material: Polycarbonate
RHEOGRAPH: Liquid cooling via oil
PVT500: Cooling via compressed air
The comparative tests were done with PVT500 and RHEOGRAPH 75 with integrated Add-on option PVT (the Add-on option “PVT“, is one of various extensions which is used successfully with GOETFFERT Capillary Rheometer) isobaric measuring mode at a cooling rate of 2,5 K/min.
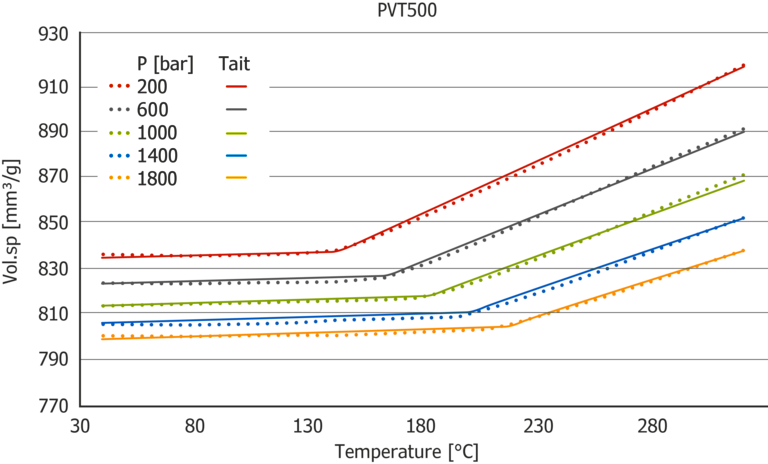 Figure 1: PVT500
Both diagrams show the same course. Though the Isobars have a more linear course with PVT 500, so this data can be approximated better with Tait-Model. The data will be approximated with the Tait-model and the 1bar pressure line will be extrapolated for evaluation (see following explanation). There are two measuring points of this 1bar-Isobar (orange arrows figure 1 and 2) which can easily be compared with other methods:
Density at room temperature (Determination by buoyancy method 23°C) and density at melt temperature (Determination by Melt Flow Indexer 300°C).
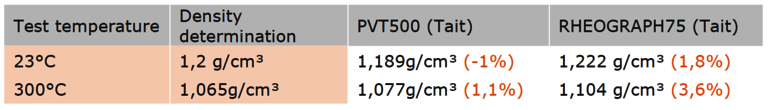 Table 1: Comparison of density values for polycarbonate at RT and 300°C
The comparison of the data indicates, that the approximated data of PVT500 shows a 1% deviation from the density of other methods. On the other hand, the approximated data with the Add-on of Capillary Rheometer shows an almost three times higher deviation.
Similar tests were performed with different polypropylene.
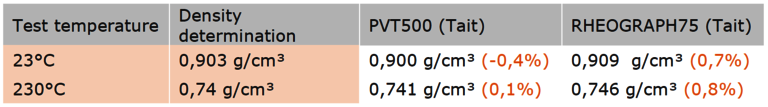 Table 2: Comparison of density values for PP at RT/30°C and 230°C
Here you can see the same effect. PVT500 exceeds the already high accuracy of the Add-on option (RHEOGRAPH 75).
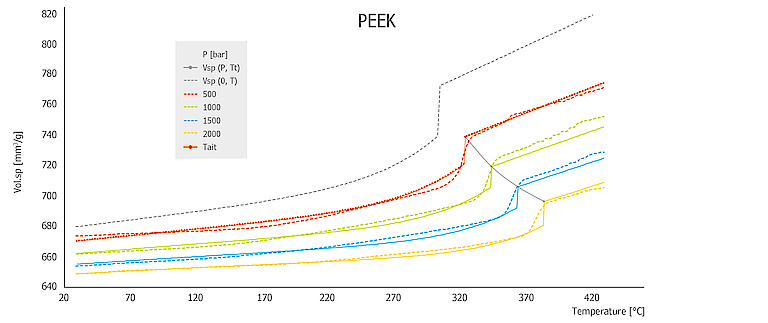
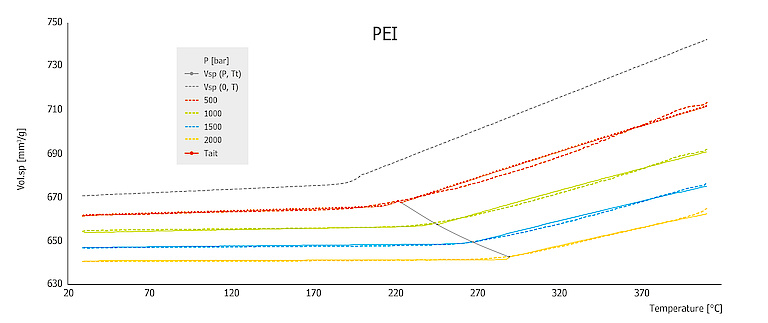
The following diagrams contain some sample data for PEEK and PEI. The data was determined with a cooling rate of 5K/min in isobaric measuring mode.
The data of PEEK show the typical behaviour for a semi-crystalline material with distinct transition zone at the melting point. The data of PEI show the typical amorphous behaviour with smooth transition in melting range.
The measurement of PEI with amorphous behaviour shows, with its better linear behaviour of the isobars, an improvement in comparison to Add-on option Capillary Rheometer.
The measured data were additionally approximated with the Tait model. On this basis, the Isobar at ambient pressure (p=0bar) was determined. The data is accurately described and summarized by the model.
The main application for modelling of pVT measurement data via the Tait-model is in simulation of injection molded components.
Because of the modelling, one is no longer limited to discreetly measured Isobars. One can also rely on interpolated model data depending on which operating point is set on the injection molding machine and how the process continues in the tool.
Such an operation is shown as example in the following diagram.
After injection phase, the holding-pressure phase takes place up until the sealing point. Then a further cooling process follows up until the tool opens.
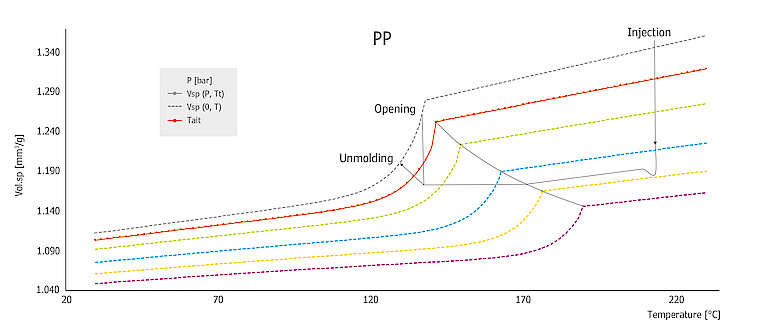 Figure 3: Tait-model
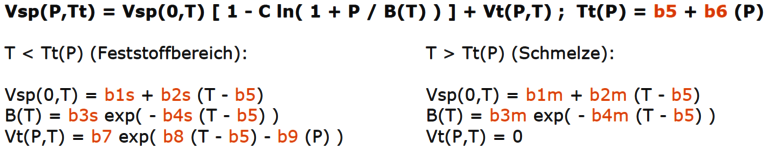
The sealing point is very important in this process. It can be determined directly from the Tait-model. The model describes the sectors solidity, transition and melt with a total of 13 parameters by the following equations:
The coefficients b5 and b6 mark the seal- or freezing line at which material freezes. The model was originally developed for saline solutions. However, in the present expansion, it describes the measurement data of thermoplastics, elastomers and thermosets quite good as well and is used in well-known injection molding simulation software like Mouldflow, Moldex, CadMould and Sigmasoft.