for effective analysis of free-flowing thermoset mixtures
In the case of elastomers or thermoplastics, the tests are established for the characterization of the materials from the raw material or the raw mixture to the finished part. In the case of thermosetting molding compounds, on the other hand, rheological characterization has not yet been possible at all or only partially possible. There is the ASTM D3123, in which the material to be tested is pressed into a spiral with 69bar. The test conditions are very far away from production, where 2000bar can also be reached. As a result, an essential link in the production chain of thermoset processing is missing: It can only be determined during production that, for example, batches of a material due to deviating processing properties under known standard parameters on a production can be processed by machine. In order to meet this demand for a meaningful quality test, the TCR described below was developed on the basis of the already established capillary rheometer principle.
The device
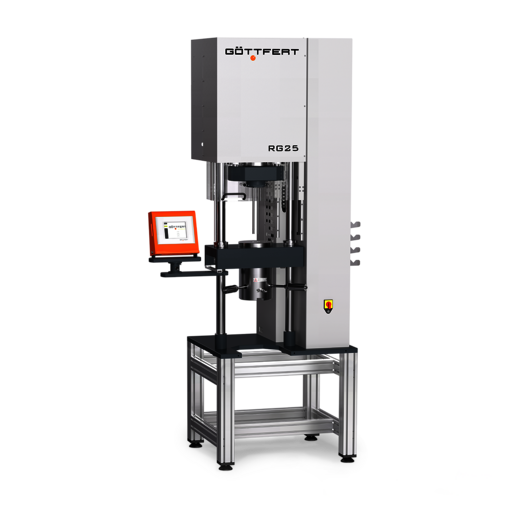
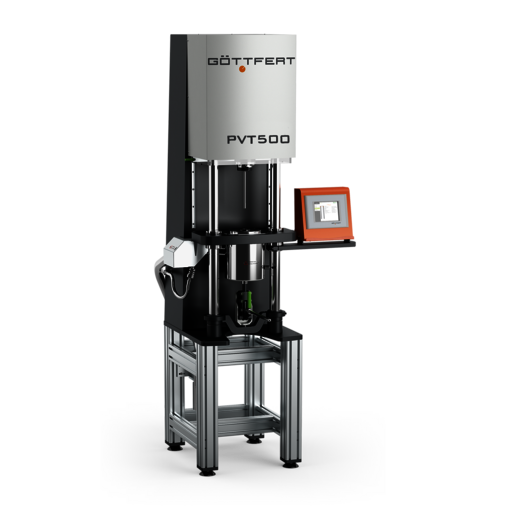
The device in Figure 1 is developed based on a capillary rheometer with 75kN piston force. The device also consists of a piston / die plate with test channel and a mould (flow spiral). To be able to easily remove the cured test material, the test channel is integrated into a conical seat in the die plate, which is divisible and easily removable. The insulation of the die plate from the upper half of the mould allows to set different temperatures between the mould and the die.
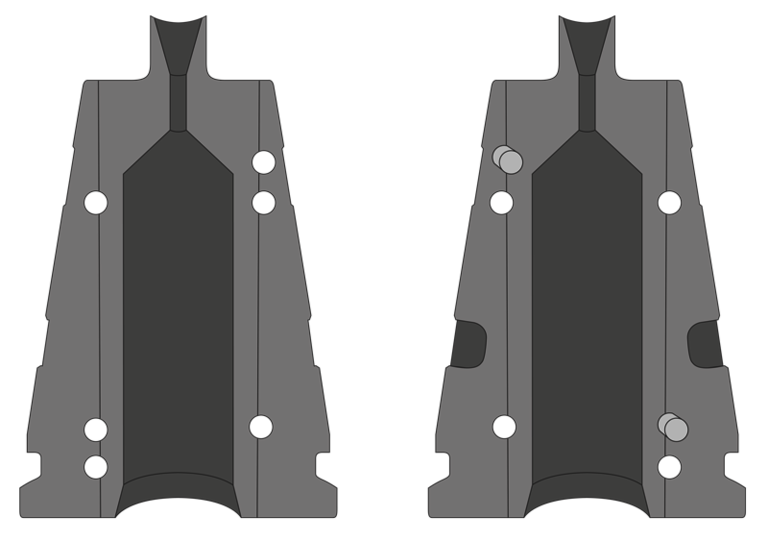
The flow spiral is equipped with 5 pressure transducers and 4 thermogradient sensors arranged in alternating order.
The first pressure sensor is located opposite the injection point so that the pressure loss via the capillary can be determined from the pressure difference of the punch pressure and the first pressure transducer.
The other pressure transducers are arranged in the flow path of the flow spiral. This results in 4 segments in the mould with the same flow length. In each segment, a thermal gradient sensor sits in the middle to correct the material temperature and to detect the processes during crosslinking. The gradient temperature sensor consists of several temperature sensors arranged one behind the other, so that in addition to the temperature, a heat flow can also be detected. Thus, the material is measured at 5 characteristic points, during the injection process and via the flow path in the tool.
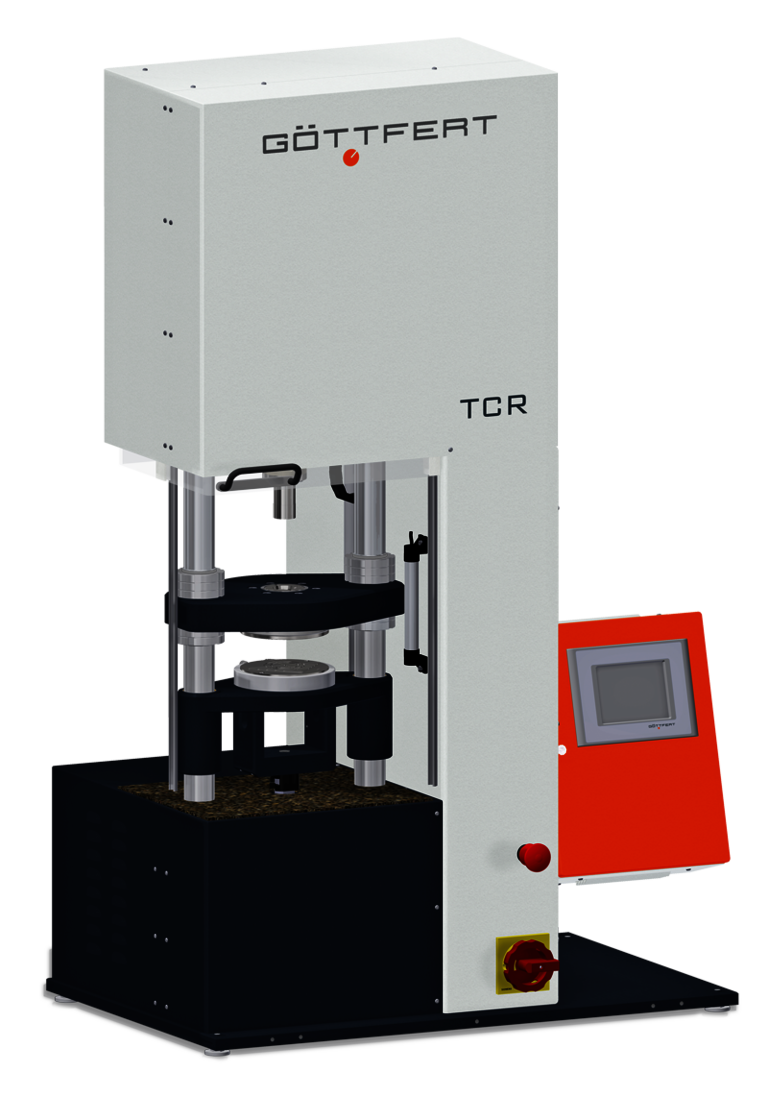 Fig. 1: TCR overview
 Divided capillary with test channel
Differential pressure through the die P0-P1
Tool1. Segment P!-P2
Tool2. Segment P2-P3
Tool3. Segment P3-P4
Tool4- Segment P4-P5
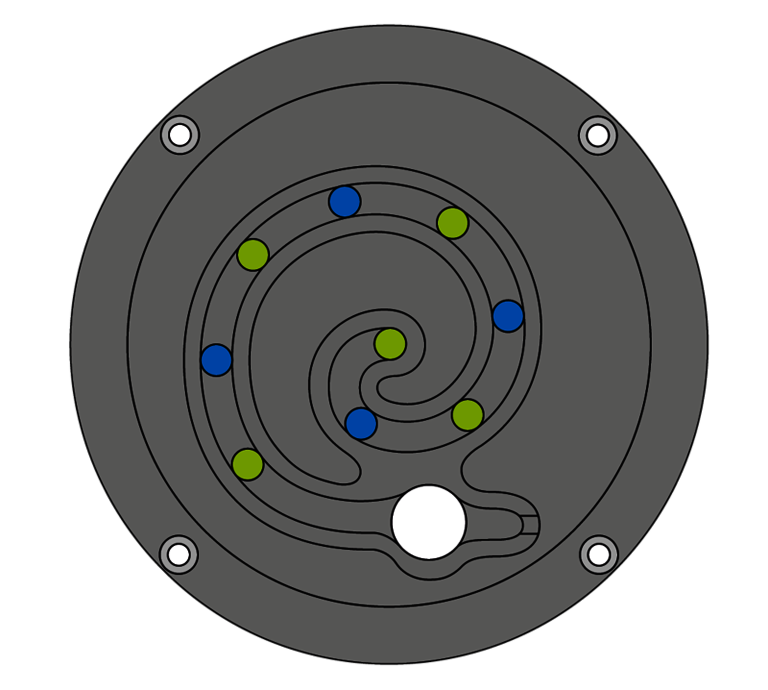 Figure 2: Flow spiral with 5 pressure transducers (green) P1(center) -P5 and 4 thermogradient sensors (blue) above the flow path
The instrument can measure at both constant pressure and constant speed. The test at constant pressure serves as a QC test for material comparison and the test at constant speed can be used to determine flow curves similar to the capillary rheometer for material and process development. For a complete characterization, several tests at different speeds are necessary, which then describe the rheokinetic behavior of the material.
Results at constant pressure for three different ones with phenolic resin masses
Three different phenolic resin samples were investigated. Two different fast crosslinking sample (1+2) and one elastomer modified sample (3). The test temperatures were selected according to the information on the processing area of the material manufacturer at 110°C for piston and capillary and 160°C in the mould.
The materials were first characterized by a dynamic test with the RPA (RubberProcessAnalyzer) regarding crosslinking at 160°C. Here, the sample 2 and 3 show a similarly low minimum, while the minimum of the mixture 1 is significantly higher. Mixture 1 is the fastest of the three mixtures and mixture 3 the slowest in vulcanisation and in T10.
Based on the data, one would expect a significantly lower injection speed at constant pressure and the most difficult processing for mixture 1.
| BATCH | MIN [NM] | MAX [NM] | T2 [S] | T10 [S] | T50 [S] | T90 [S] |
| 1 | 0.0213 | 1.0164 | 10.21 | 15.22 | 22.22 | 69.24 |
| 2 | 0.0036 | 1.0938 | 13.74 | 18.75 | 45.23 | 77.28 |
| 3 | 0.0044 | 0.8724 | 18.70 | 25.75 | 51.73 | 78.27 |
The injection test was carried out at a constant pressure of 800 bar. Contrary to the results of the crosslinking curve shown above, the course of the injected volume shows that the mould filling is fastest at a constant pressure of 800bar with sample 1 and slowest for sample 3. From the pressure loss over the capillary calculated from the punch pressure and the 1st pressure transducer in the mold, the rheological values can be calculated at injection temperature. This shows that mixture 1 has a higher viscosity at low shear rates, which correlates with the RPA for measurement, but a lower viscosity at high shear rates, such as those present during the injection process.
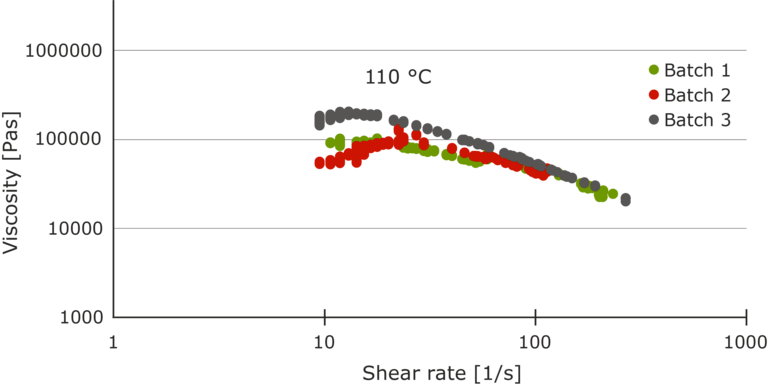 Fig. 3: Comparison of the flow curve at injection temperature
Thus, the behavior in the injection molding machine is completely different from what the crosslinking data of the vulcanization curve predict. In the mold, the viscosity curve can then be recorded during the injection process via the pressure differences P1-P2 to P4-P5. The temperature measurement between the segments is used for correction.
After complete filling, there is a low material leakage at the vent of the mould. The experiment is then continued until there is no more flow. From the temporal pressure curve after the complete mould filling, the crosslinking behavior can now be determined from the pressure loss in the first mould segment, into which previously fresh material flowed in at high speed, on the basis of the shear stress curve similar to the RPA. Thus, in addition to rheological testing under processing conditions, the test with the TCR allows data of the crosslinking comparable to laboratory tests with an RPA or vulcameter to be generated. In addition, the course of the temperature in the gradient sensors provides information about the temporal course of the crosslinking.
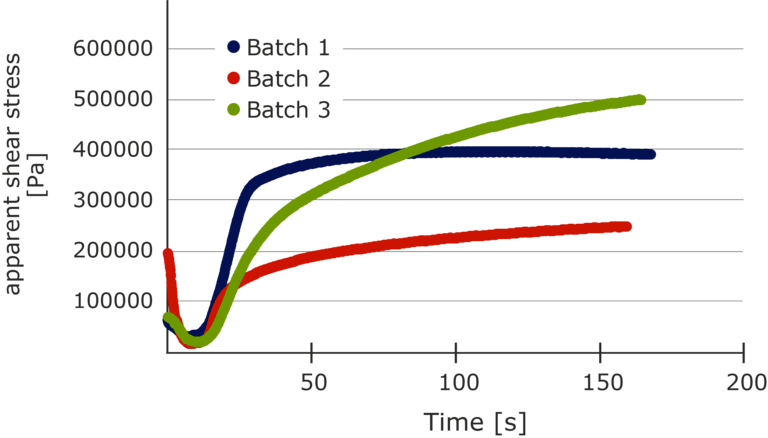 Fig. 4: Vulcanization process of the samples after injection measured by TCR
Since the previous evaluation was obtained from one test at a time, the test method at constant pressure is ideally suited for the quality control of thermosets.
Measurement at constant volume velocity
In addition to measuring at constant pressure, the device also allows testing at a constant volume velocity. This enables an experiment like the capillary rheometer. However, since the kinetics of the materials are superimposed on rheology, it is necessary to carry out a separate test for each shear rate and not to run different shear rates one after the other. Here, every volume speed (i.e., every shear rate) is driven until the pressure has leveled off at a stationary level.
From the individual pressures P0-P5, the quasi-stationary pressure differences are now calculated and from this now five viscosity values are calculated, one in the capillary at the injection temperature and four in the mold with different residence times.
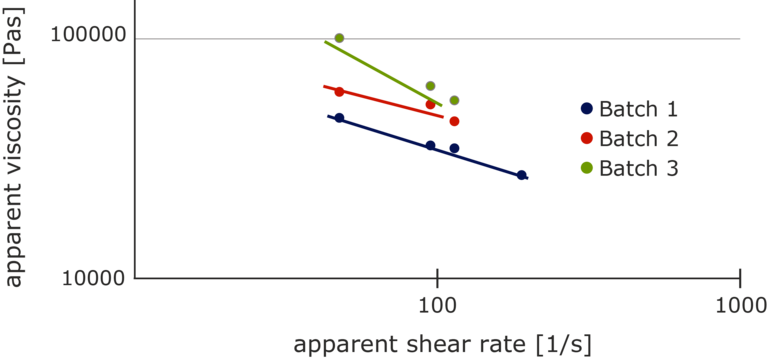 Fig 5: apparent flow curve at 110°C
Figure 5 shows the viscosity curve from the pressure loss via the die at 110°C. In contrast to the measurement of the vulcanization behavior in the RPA, there is a very large differentiation of the samples with also different behavior. Sample 1 could be measured up to a shear rate of 190 1/s, while the other two samples could only be measured up to about 120 1/s due to the much higher viscosity. All examined samples show the flow behavior according to Ostwald de Waele (Power Law).
Based on the temperature measurement, from the 3rd segment the set mould temperature of 160°C is also reached in the material. The following diagram shows the viscosity curve of the samples at 160°C. As expected, the data are much closer together here. The viscosity of sample 1 is higher than that of sample 2 at high shear rates and vice versa at low shear rates. However, since the viscosity at 160°C is an order of magnitude lower than at 110°C, the differences for total pressure loss are not as relevant as the pressure loss in the die at 110°C, which is the determining element here.
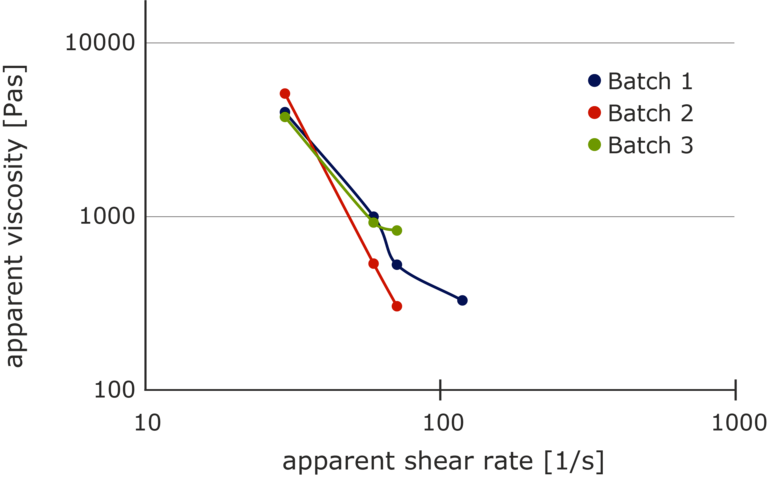 Fig.6: Apparent flow curve at 160°C in segment 3
Measurement at constant volume velocity provides comprehensive rheological characterization under constant conditions. However, in contrast to testing at constant pressure, at which not only the speed but also the time changes, 3-5 tests per material and temperature are necessary. This test mode is therefore particularly suitable for initial material characterization.
Conclusion
In the case of thermosetting molding compounds, rheological characterization has not yet been possible at all or only to some extent with test conditions far from production. Based on the pressure flow principle of the capillary rheometer, the TCR described below was developed. The instrument consists of a temperature-controlled feed channel in which the material is preconditioned under defined pressure and volume at a preselected temperature and pressed into a flow spiral with up to 5 pressure and 4 gradient temperature sensors at a pressure of up to 1600bar.
The device allows an effective determination of the rheological properties in the range of the injection temperature and over the flow path in the mold at crosslinking temperature. During the experiment, the crosslinking behavior like the measurement in the vulcameter (RPA) can also be described from the temporal course of the rheological properties. In addition, the temporal course of the gradient temperature sensors differentiates the crosslinking behavior of the materials.