Extended parameter range and functionality open new testing possibilities
Measuring range torque: 25Nm
Measuring range force (optional): 10kN
Frequency Range: 0.001-120Hz
Dynamic deflection: ±0.01 - ±360°
Deflection ramp: up to 720°
New functionality: LAOS with FFT evaluation Transient viscosity
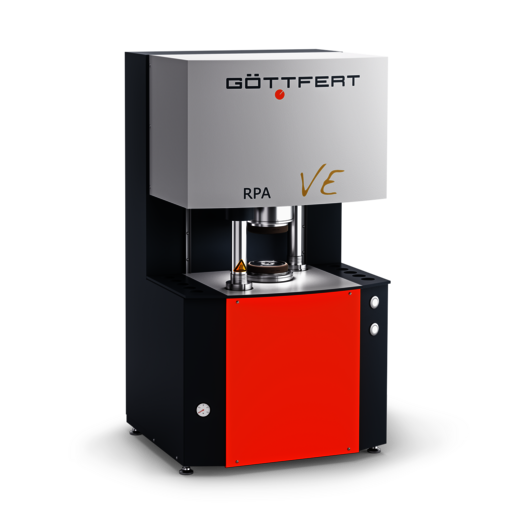
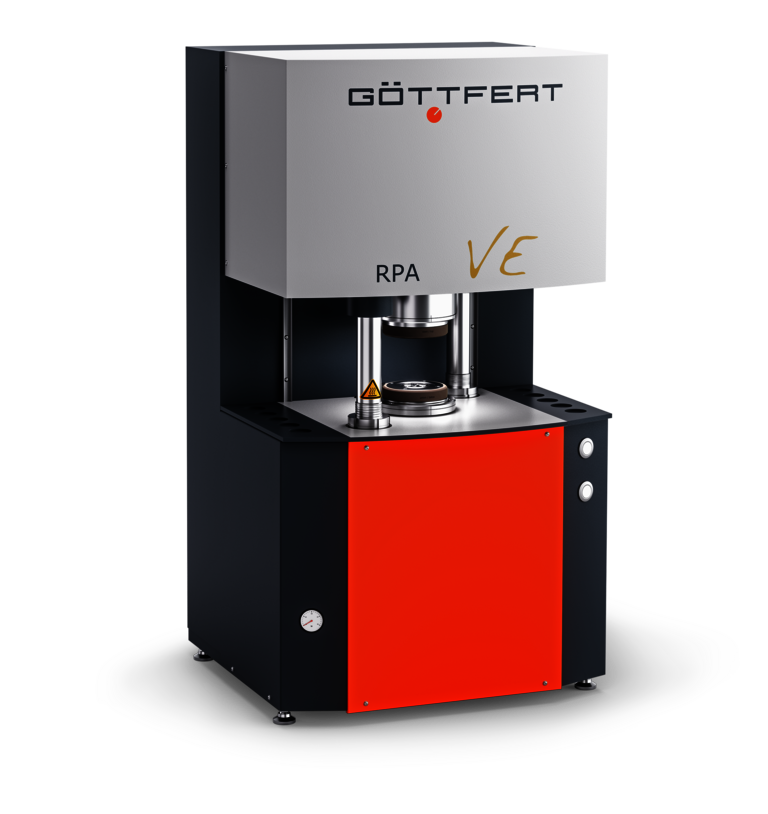 Figure 1: The new RPA with extended functionality
Expanded ability to characterize polymers and polymer mixtures with FFT delivers high selectivity
Polymer branching has a major influence on processing, especially in injection molding, extrusion and blow molding or film blow molding. The polymer branching causes an extension of the relaxation time and high stretch viscosity recognizable also by the phenomenon of strain hardening. Quantitative characterization of the branching, but only short-chain branching, can be carried out using chemical methods in conjunction with FTIR and NMR. Rheological methods such as amplitude sweats for small deflections, time-temperature diagrams and strain viscosity measurement are widely used, but sometimes do not provide the necessary differentiation or are complex to carry out.
Large Amplitude Oscillatory Shear (LAOS) is a widely used easy-to-use method for characterizing the nonlinear material response, which provides a much higher selectivity. In the LAOS test, a sample is excited with a simple sinusoidal large deflection. The response signal is not a simple sinusoidal signal with a correspondingly large deflection. Using a Fast Fourier Transform (FFT), the signal can be broken down into frequencies of integer multiples of the excitation frequency. Here, the even multiples reflect the reaction of the test support and should ideally not be present, while the odd multiples reflect the reaction of the material. Each of these higher harmonics has its own phase shift and is sensitive to the molecular material architecture. The entire LAOS response signal can also be applied as Lissajou's figure voltage over shear velocity.
The following diagram shows a typical Lissajous figure of a linear polymer for an EPDM rubber determined at the RPA described above.
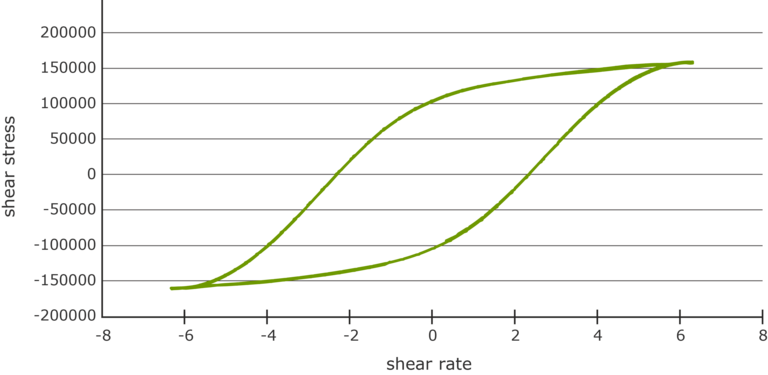 Figure 2: Lissajou's figure for an EPDM polymer
Usually, a rheological analysis is performed via dynamic frequency weeps in the linear-elastic range of the strain. This often results in a material differentiation at small circuit frequencies. The following example shows two batches of EPDM raw rubber where it is not possible to differentiate by method.
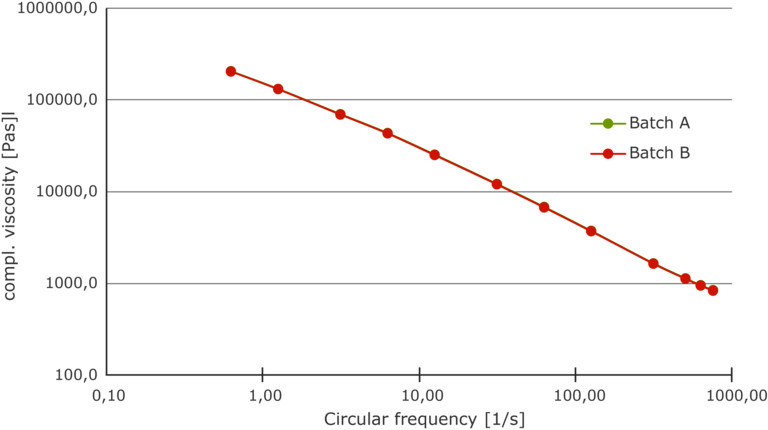 Figure 3: Frequency tweet for 2 similar EPDM batches
An extended test method is provided by the amplitude weep down to the nonlinear viscoelastic deformation range. Here, the new RPA offers an extension of the oscillation amplitude by a factor of 4 to ±360°. Figure 4 shows a comparison of the moduli G ́ and G ́ ́ of the two batches in the range of 1-3000%. With G ́, above 1000%, in the extended parameter range of the new RPA, a slight distinction is recognized, but this only accounts for a small single-digit percentage range <5%.
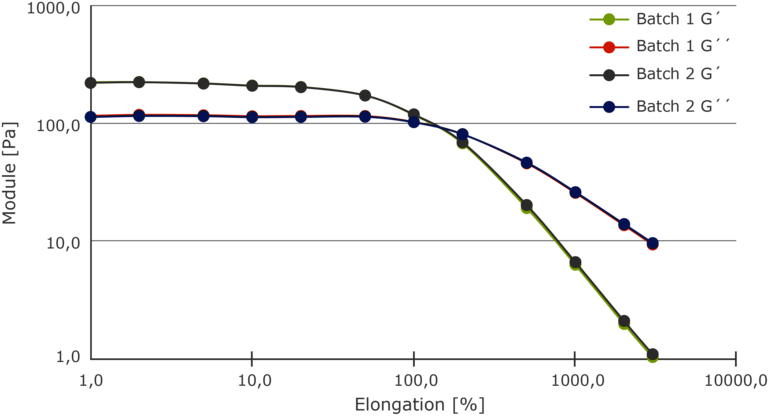 Figure 4
The signals of the deflection and the response signal were analyzed with the Fast Fourier Transformation (FFT).
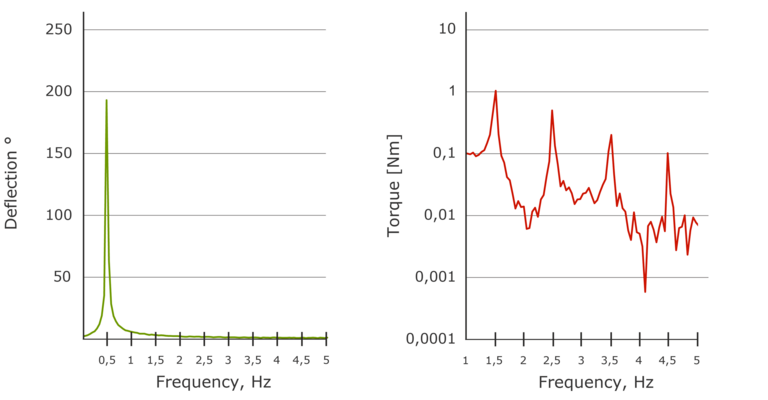 Figure 5: FFT analysis at 3000 % shows the high quality of the drive
On the left in Figure 5 shows the signal of the deflection. Here only the fundamental frequency of 0.5Hz is visible in the signal. The high quality of the drive now allows a very good evaluation of the response signal. The response signal of the material represented by the torque now shows the fundamental frequency and all harmonics as odd multiples of the fundamental frequency (3.5.7.9th order. The 9th order is also still very visible here. The higher-order response signal is essentially determined by the structure of the material branching.
To simplify the evaluation about branching when comparing different materials, the empirical LCB value shown below was developed /Burhin e.a./.
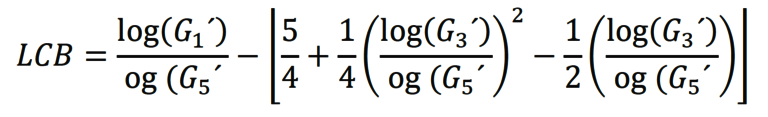
Herein is G'the respective memory module of the 1st, 3rd and 5th order. The LCB value is usually determined at 1000% strain.
For the two EPDM samples, Figure 6 shows the response signal in comparison.
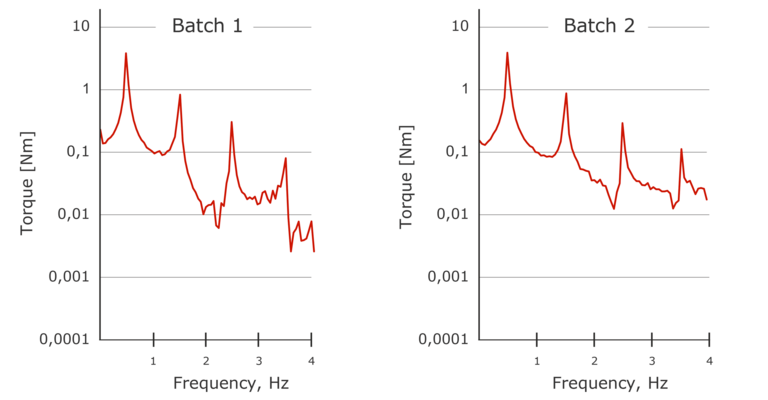 Figure 6: FFT response signal of torque at 1000% strain for 2 EPDM batches
Here, the two response signals (torque) of the samples differ significantly from the 3rd order of the fundamental frequency. From these data, the respective module (1.3.5. order) and the LCB value for the respective sample can be calculated using the above equation. The LCB value is between -3 and 1 where -3 is a linear structure of the sample. With increasing value, the degree of branching increases.
| LCB-Value | |
| Batch 1 | -2,10203 |
| Batch 2 | -2,49571 |
The LCB value of batch 2 is about 16% lower than that of batch 1, so the sample has fewer branches. Thus, compared to the classical methods of dynamic testing of the rheological properties via frequency and amplitudesweep (here < 5%), a significantly higher selectivity is possible without FFT via the FFT evaluation.
Determination of transient viscosity
In addition to the dynamic testing of the rheological properties, the test is also carried out in rotational rheometers at constant angular velocity to detect the stationary viscosity. Stationary viscosity provides measurement data that is more similar to later processing than dynamic data. The measurement is carried out here via a sudden change in the angular velocity or the shear velocity and is also referred to as a clamping test. In response to the specification of the shear speed, the response is the torque and thus the shear stress over time. From this, the viscosities (γ, t) the moduli and the relaxation times can be calculated. The viscositesreach equilibrium after a sufficiently long time. This value is also known as transient viscosity.
By extending the oscillation amplitude to ±360°, the clamping test can now be carried out in a much wider range than with the previous oscillation amplitude of ±90° and thus a complete flow curve can be recorded.
Figure 7 shows the raw data of 7 ramp tests with an SBR mixture.
Shown on the left is the course of the deflection of the sample for 7 different deflection speeds. Due to the high accuracy and pulling force, the drive reaches the desired deflection speed almost instantaneously, which ultimately represents the desired shear speed.
Shown on the right is the reaction moment, which settles down to the quasi-stationary level after a short time. This level results in the shear stress for the stationary shear (constant shear velocity).
From the experiments shown above, a flow curve can now be created. The flow curve of the transient (stationary) viscosity obtained in this way can now be compared with the flow curve from the dynamic test of complex viscosity. From this experiment, it can be checked to what extent the Cox-Merz rule applies.
Figure 8 shows such a comparison for the SBR mixture.
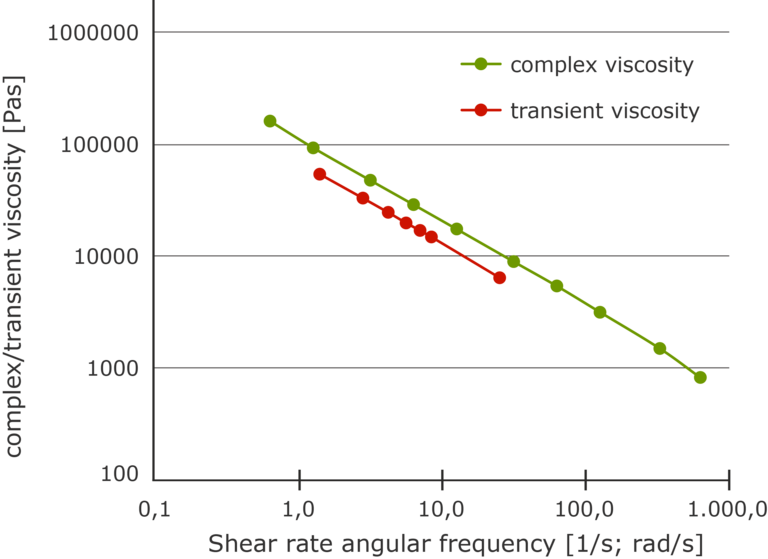 Figure 8: Comparison between complex and transient viscosity (SBR mixture)
The data shows a different level and a slightly different slope of the curves. It turns out that the Cox-Merz rule does not apply to this case and that the viscosity data of the dynamic measurement cannot be used to simulate stationary flows for this material. As a result of the profiled test chamber of the RPA, it can be assumed that the data of the transient viscosity are free of wall sliding phenomena. Thus, the transient viscosity in the capillary rheometer test can help to better separate the adhesion and sliding component in the capillary flow.
Summary
The new RPA has been extended by the functionality with the FFT evaluation of the test at strain in the non-linear viscoelastic range LargeOscillatoryScanning (LAOS) and the enlargement of the oscillatory trion angle to ±360°. Using an example of a raw rubber, it is shown that the FFT evaluation of the LAOS test and the extension of the oscillation angle provides a significantly higher selectivity in the material differentiation. The oscillation angle of ±360° also opens up the possibility of determining the transient (stationary) viscosity. The stationary viscosity is used to check the Cox-Merz relationship and opens the possibility of better separating the sliding and adhesive components in the capillary rheometer test to generate better data on machine design.